欢迎访问《农学学报》,
农学学报 ›› 2025, Vol. 15 ›› Issue (8): 88-100.doi: 10.11923/j.issn.2095-4050.cjas2024-0113
• 三农问题研究 三农产业结构 • 上一篇
毛昭庆1( ), 张晓娇1, 刘树芳2, 曾贞2, 伏成秀2()
收稿日期:2024-06-05
修回日期:2024-10-13
出版日期:2025-08-18
发布日期:2025-08-18
通讯作者:
作者简介:毛昭庆,女,1990年出生,湖北潜江人,硕士,助理研究员,主要从事农业产业经济研究。通信地址:650200 云南省昆明市盘龙区北京路2238号 云南省农业科学院农业经济与信息研究所,Tel:0871-65899802,E-mail:809499657@qq.com。
基金资助:
MAO Zhaoqing1(), ZHANG Xiaojiao1, LIU Shufang2, ZENG Zhen2, FU Chengxiu2()
Received:2024-06-05
Revised:2024-10-13
Online:2025-08-18
Published:2025-08-18
摘要:
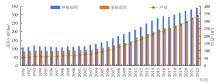
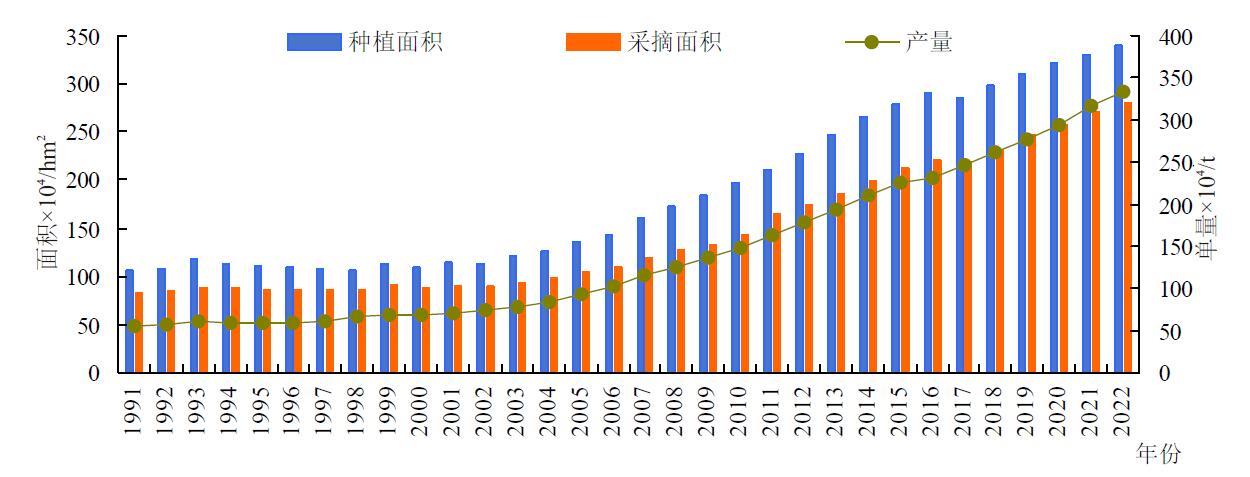
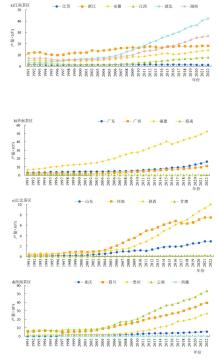
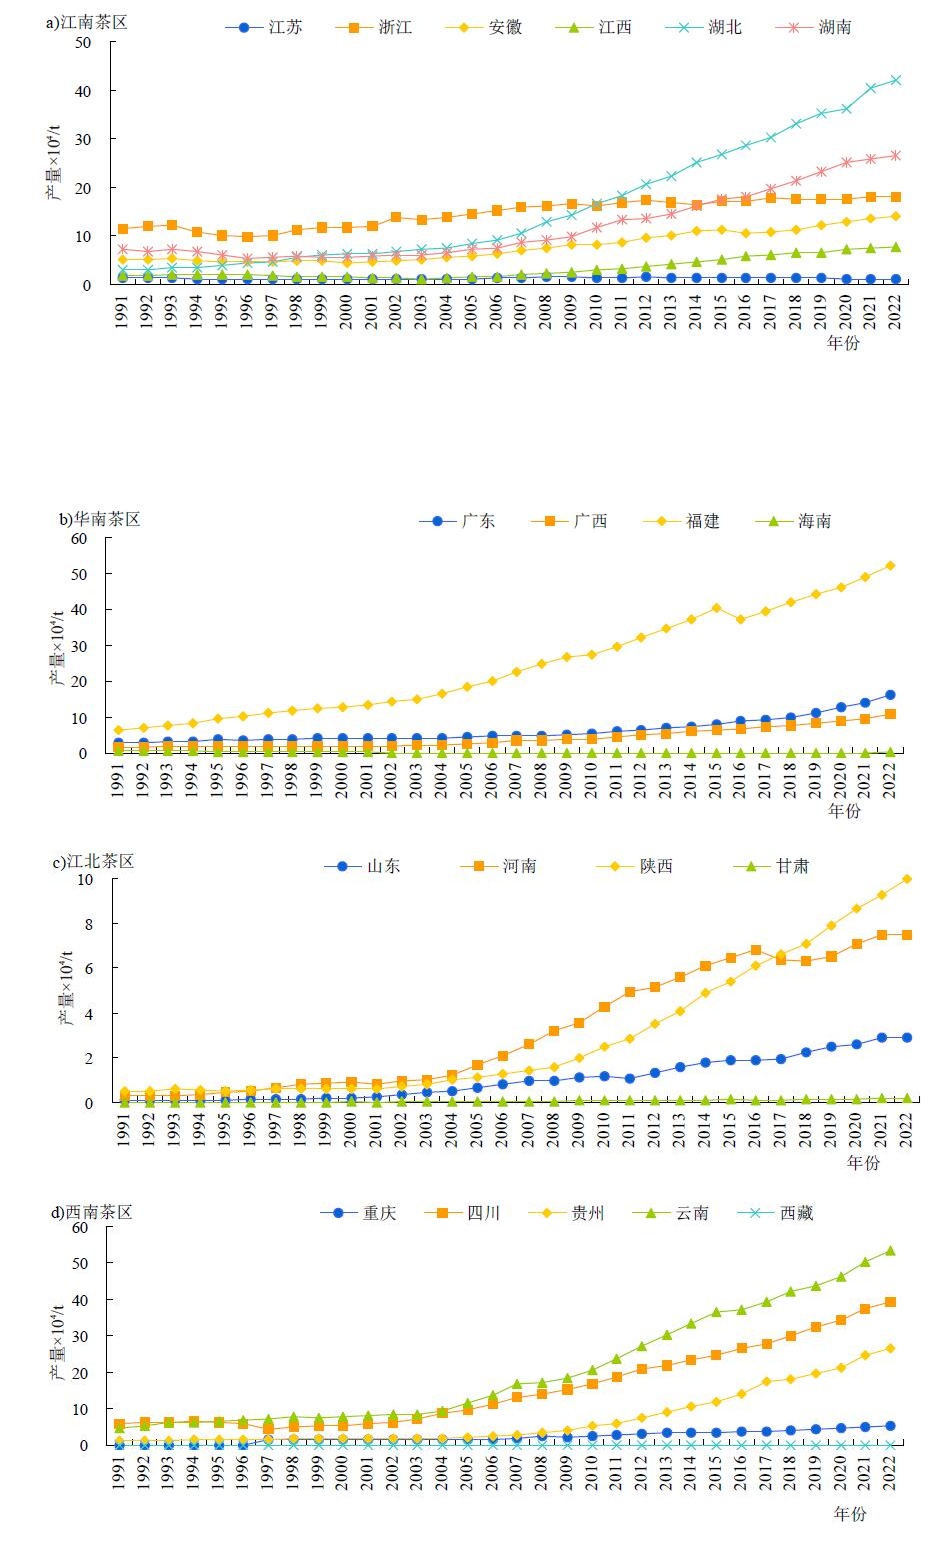
本研究旨在探讨中国茶叶产量增长的主要贡献因素及其空间格局特征。通过分析1991—2022年中国各省域的茶叶种植面积、产量和单产数据,运用对数平均迪氏分解法(LMDI)模型,从全国、区域和省域3个层面进行分析。结果表明,(1)从增长数量来看,1991—2022年中国茶叶生产规模不断扩大,茶园面积和茶叶产量均呈现出持续增长的发展态势,茶叶种植面积增长前3位的四川、云南、贵州共贡献了茶叶种植面积总增长量的47.73%,茶叶产量增长前4位的四川、湖北、福建、云南共贡献了茶叶产量总增长量的59.53%,西南茶区是中国茶叶增产的主导区域。(2)从增长幅度来看,低于全国平均增速的“滞后增产”层级和高于全国平均增速的“超速增产”层级的省份最多,均有6个省份,分别是浙江、安徽、重庆、湖南、江西、广东以及云南、湖北、贵州、陕西、河南、山东,西南茶区位于“快速增产”层级,江北茶区位于“超速增产”层级。(3)西南茶区的茶叶种植面积贡献最明显,华南茶区的茶叶单产贡献最显著,全国有16个省份的茶叶种植面积贡献较大,仅有3个省份的茶叶单产贡献较大,茶叶种植面积扩大对增产贡献极显著的省份有贵州、山东、甘肃、江苏和西藏,茶叶单产提升对增产贡献极显著的省份仅有海南。为提高全国茶叶生产能力和增长潜力,应加强茶叶生产基地建设,深化茶叶精深加工,提升茶叶品牌效益。
毛昭庆, 张晓娇, 刘树芳, 曾贞, 伏成秀. 中国茶叶增产格局与贡献因素分析[J]. 农学学报, 2025, 15(8): 88-100.
MAO Zhaoqing, ZHANG Xiaojiao, LIU Shufang, ZENG Zhen, FU Chengxiu. Analysis of Pattern and Contribution Factors of Increasing Tea Production in China[J]. Journal of Agriculture, 2025, 15(8): 88-100.
| 增产量×104t | 数量/个 | 省份 | 占比/% |
|---|---|---|---|
| [0~以下 | 3 | 海南、江苏、西藏 | -0.21 |
| (0,10] | 9 | 甘肃、山东、重庆、江西、浙江、河南、安徽、广西、陕西 | 19.98 |
| (10~30] | 3 | 广东、湖南、贵州 | 20.70 |
| (30~以上 | 4 | 四川、湖北、福建、云南 | 59.53 |
| 增产量×104t | 数量/个 | 省份 | 占比/% |
|---|---|---|---|
| [0~以下 | 3 | 海南、江苏、西藏 | -0.21 |
| (0,10] | 9 | 甘肃、山东、重庆、江西、浙江、河南、安徽、广西、陕西 | 19.98 |
| (10~30] | 3 | 广东、湖南、贵州 | 20.70 |
| (30~以上 | 4 | 四川、湖北、福建、云南 | 59.53 |

| 面积增量/104hm2 | 数量/个 | 省份 | 占比/% |
|---|---|---|---|
| [0~以下 | 1 | 海南 | -0.24 |
| (0,10] | 10 | 西藏、甘肃、江苏、山东、浙江、广东、重庆、江西、广西、安徽 | 19.61 |
| (10~30] | 5 | 河南、湖南、福建、陕西、湖北 | 32.90 |
| (30~以上 | 3 | 四川、云南、贵州 | 47.73 |
| 面积增量/104hm2 | 数量/个 | 省份 | 占比/% |
|---|---|---|---|
| [0~以下 | 1 | 海南 | -0.24 |
| (0,10] | 10 | 西藏、甘肃、江苏、山东、浙江、广东、重庆、江西、广西、安徽 | 19.61 |
| (10~30] | 5 | 河南、湖南、福建、陕西、湖北 | 32.90 |
| (30~以上 | 3 | 四川、云南、贵州 | 47.73 |
| 层次 | 增产幅度 | 区域 | 省份 |
|---|---|---|---|
| 绝对减产 | 0以下 | - | 海南、江苏、西藏 |
| 滞后增产 | 0~500% | 江南茶区(265.33%) | 浙江、安徽、重庆、湖南、江西、广东 |
| 同步增产 | 500%~800% | 华南茶区(600.88%) | 四川、广西、福建 |
| 快速增产 | 800%~1000% | 西南茶区(928.81%) | 甘肃 |
| 超速增产 | 1000%以上 | 江北茶区(2139.13%) | 云南、湖北、贵州、陕西、河南、山东 |
| 层次 | 增产幅度 | 区域 | 省份 |
|---|---|---|---|
| 绝对减产 | 0以下 | - | 海南、江苏、西藏 |
| 滞后增产 | 0~500% | 江南茶区(265.33%) | 浙江、安徽、重庆、湖南、江西、广东 |
| 同步增产 | 500%~800% | 华南茶区(600.88%) | 四川、广西、福建 |
| 快速增产 | 800%~1000% | 西南茶区(928.81%) | 甘肃 |
| 超速增产 | 1000%以上 | 江北茶区(2139.13%) | 云南、湖北、贵州、陕西、河南、山东 |
| 区域 | 省份 | 总体增产/104t | 递增情况 | 面积贡献率/% | 面积贡献量/104t | 单产贡献率/% | 单产贡献量/104t | 主要贡献因素 |
|---|---|---|---|---|---|---|---|---|
| 江南 茶区 | 江苏 | -0.20 | 16增15减 | 551.15 | 1.10 | -651.15 | -1.30 | 面积 |
| 浙江 | 6.70 | 26增5减 | 58.84 | 3.94 | 41.16 | 2.76 | 面积 | |
| 安徽 | 9.10 | 20增10减1平 | 55.22 | 5.03 | 44.78 | 4.07 | 面积 | |
| 江西 | 5.80 | 21增10减 | 54.08 | 3.14 | 45.92 | 2.66 | 面积 | |
| 湖北 | 39.00 | 31增 | 59.18 | 23.08 | 40.82 | 15.92 | 面积 | |
| 湖南 | 19.20 | 17增14减 | 61.55 | 11.82 | 38.45 | 7.38 | 面积 | |
| 华南 茶区 | 广东 | 13.40 | 31增 | 47.38 | 6.35 | 52.62 | 7.05 | 单产 |
| 广西 | 9.30 | 31增 | 75.04 | 6.98 | 24.96 | 2.32 | 面积 | |
| 福建 | 45.60 | 31增 | 33.70 | 15.37 | 66.30 | 30.23 | 单产 | |
| 海南 | -0.40 | 2增29减 | -111.16 | -0.44 | 11.16 | 0.04 | 单产 | |
| 江北 茶区 | 山东 | 2.80 | 28增2减1平 | 92.13 | 2.58 | 7.87 | 0.22 | 面积 |
| 河南 | 7.20 | 30增1平 | 65.85 | 4.74 | 34.15 | 2.46 | 面积 | |
| 陕西 | 9.50 | 30增1平 | 55.69 | 5.29 | 44.31 | 4.21 | 面积 | |
| 甘肃 | 0.18 | 25增5减1平 | 140.48 | 0.25 | -40.48 | -0.07 | 面积 | |
| 西南 茶区 | 重庆 | 3.80 | 26增 | 63.45 | 2.41 | 36.55 | 1.39 | 面积 |
| 四川 | 33.30 | 25增6平 | 71.50 | 23.81 | 28.50 | 9.49 | 面积 | |
| 贵州 | 25.30 | 30增1平 | 87.84 | 22.22 | 12.16 | 3.08 | 面积 | |
| 云南 | 48.60 | 31增 | 50.08 | 24.34 | 49.92 | 24.26 | 面积 | |
| 西藏 | -0.0003 | 3增28减 | 14849.28 | 0.04 | -14949.28 | -0.04 | 面积 |
| 增产量/104t | 增产类型 | ||||
|---|---|---|---|---|---|
| 绝对减产0以下 | 滞后增产0~500% | 同步增产500%~800% | 快速增产800%~1000% | 超速增产1000%以上 | |
| [0~以下 | 海南、江苏、西藏 | - | - | - | - |
| (0,10] | - | 浙江、安徽、重庆、江西 | 广西 | 甘肃 | 山东、河南、陕西 |
| (10~30] | - | 湖南、广东 | - | - | 贵州 |
| (30~以上 | - | - | 四川、福建 | - | 湖北、云南 |
| 增产量/104t | 增产类型 | ||||
|---|---|---|---|---|---|
| 绝对减产0以下 | 滞后增产0~500% | 同步增产500%~800% | 快速增产800%~1000% | 超速增产1000%以上 | |
| [0~以下 | 海南、江苏、西藏 | - | - | - | - |
| (0,10] | - | 浙江、安徽、重庆、江西 | 广西 | 甘肃 | 山东、河南、陕西 |
| (10~30] | - | 湖南、广东 | - | - | 贵州 |
| (30~以上 | - | - | 四川、福建 | - | 湖北、云南 |
| 年份 | 累计增产量/104t | 种植面积贡献量/104t | 单产贡献量/104t | 种植面积贡献率/% | 单产贡献率/% | 连增状况 |
|---|---|---|---|---|---|---|
| 1991 | - | - | - | - | - | 基准年 |
| 1992 | 1.70 | 1.24 | 0.46 | 72.67 | 27.33 | 始增 |
| 1993 | 5.66 | 5.66 | -0.001 | 100.02 | -0.02 | 二连增 |
| 1994 | 4.51 | 3.85 | 0.66 | 85.30 | 14.70 | 始减 |
| 1995 | 4.52 | 2.87 | 1.66 | 63.36 | 36.64 | 始增 |
| 1996 | 5.01 | 2.25 | 2.76 | 44.90 | 55.10 | 二连增 |
| 1997 | 7.00 | 0.87 | 6.14 | 12.35 | 87.65 | 三连增 |
| 1998 | 12.17 | -0.21 | 12.38 | -1.73 | 101.73 | 四连增 |
| 1999 | 13.25 | 3.89 | 9.36 | 29.37 | 70.63 | 五连增 |
| 2000 | 14.00 | 1.64 | 12.36 | 11.73 | 88.27 | 六连增 |
| 2001 | 15.84 | 4.53 | 11.31 | 28.61 | 71.39 | 七连增 |
| 2002 | 20.21 | 4.33 | 15.88 | 21.42 | 78.58 | 八连增 |
| 2003 | 22.48 | 8.44 | 14.05 | 37.52 | 62.48 | 九连增 |
| 2004 | 29.19 | 11.85 | 17.34 | 40.59 | 59.41 | 十连增 |
| 2005 | 39.15 | 17.55 | 21.61 | 44.81 | 55.19 | 十一连增 |
| 2006 | 48.47 | 22.81 | 25.67 | 47.05 | 52.95 | 十二连增 |
| 2007 | 62.22 | 34.22 | 27.99 | 55.01 | 44.99 | 十三连增 |
| 2008 | 71.43 | 41.16 | 30.27 | 57.63 | 42.37 | 十四连增 |
| 2009 | 81.53 | 49.45 | 32.08 | 60.65 | 39.35 | 十五连增 |
| 2010 | 93.17 | 57.81 | 35.36 | 62.05 | 37.95 | 十六连增 |
| 2011 | 107.99 | 68.03 | 39.96 | 63.00 | 37.00 | 十七连增 |
| 2012 | 124.64 | 80.05 | 44.59 | 64.22 | 35.78 | 十八连增 |
| 2013 | 138.11 | 92.30 | 45.81 | 66.83 | 33.17 | 十九连增 |
| 2014 | 155.24 | 105.34 | 49.89 | 67.86 | 32.14 | 二十连增 |
| 2015 | 170.57 | 116.24 | 54.33 | 68.15 | 31.85 | 二十一连增 |
| 2016 | 176.99 | 123.02 | 53.97 | 69.50 | 30.50 | 二十二连增 |
| 2017 | 191.70 | 125.44 | 66.26 | 65.44 | 34.56 | 二十三连增 |
| 2018 | 206.70 | 136.35 | 70.36 | 65.96 | 34.04 | 二十四连增 |
| 2019 | 223.37 | 147.10 | 76.27 | 65.86 | 34.14 | 二十五连增 |
| 2020 | 238.75 | 157.19 | 81.56 | 65.84 | 34.16 | 二十六连增 |
| 2021 | 261.97 | 169.15 | 92.83 | 64.57 | 35.43 | 二十七连增 |
| 2022 | 279.68 | 179.06 | 100.62 | 64.02 | 35.98 | 二十八连增 |
| [1] |
王刻铭, 刘仲华. 全产业链视角下我国茶叶产业发展路径分析[J]. 湖南师范大学自然科学学报, 2019, 42(4):83-88.
|
| [2] |
刘书祎. 我国茶叶产业发展的经济学分析[J]. 福建茶叶, 2016, 38(5):7-8.
|
| [3] |
刘仲华. 中国茶叶深加工产业发展历程与趋势[J]. 茶叶科学, 2019, 39(2):115-122.
|
| [4] |
周智修, 薛晨, 阮浩耕. 中华茶文化的精神内核探析——以茶礼、茶俗、茶艺、茶事艺文为例[J]. 茶叶科学, 2021, 41(2):272-284.
|
| [5] |
温思美, 黄冠佳, 郑晶, 等. 改革开放以来我国三农问题关注重点变化及其演进逻辑[J]. 农业经济问题, 2018(12):4-13.
|
| [6] |
朱伟丽, 陈江华, 李道和. 中国茶产业政策与全要素生产率变动[J]. 茶叶科学, 2022, 42(6):886-899.
|
| [7] |
封志明, 孙通, 杨艳昭. 2003—2013年中国粮食增产格局及其贡献因素研究[J]. 自然资源学报, 2016, 31(6):895-907.
doi: 10.11849/zrzyxb.20151220 |
| [8] |
张锦宗, 朱瑜馨, 赵飞, 等. 我国粮食生产格局演变及增产贡献研究[J]. 中国农业资源与区划, 2017, 38(7):10-16+35.
|
| [9] |
王军, 张越杰. 中国粮食增产的主要因素贡献分解与实证估算[J]. 统计与决策, 2020, 36(1):44-48.
|
| [10] |
段健, 徐勇, 徐小任. 1985—2015年黄土高原地区粮食生产空间格局变化及原因[J]. 水土保持研究, 2019, 26(5):381-388.
|
| [11] |
耿仲钟, 肖海峰. 我国长江中下游地区粮食生产变化及贡献因素分析[J]. 江汉学术, 2017, 36(4):103-108.
|
| [12] |
张越, 郭耀辉, 赵颖文. 基于LMDI分解模型的中国粮食主产区增产格局及贡献因素研究[J]. 农学学报, 2023, 13(3):95-101.
doi: 10.11923/j.issn.2095-4050.cjas2021-0196 |
| [13] |
王倩, 张郁, 邹小娇. 基于LMDI的三江平原地区粮食增产影响因素研究[J]. 中国农业资源与区划, 2020, 41(11):103-109.
|
| [14] |
朱晶, 李天祥, 朱珏. 江苏省粮食增产的贡献因素分解与测算(2004—2013年)——基于粮食内部种植结构调整的视角[J]. 华东经济管理, 2015, 29(3):11-16.
|
| [15] |
李福夺, 杨兴洪. 1999—2014年山东省粮食生产变化及增产驱动力研究[J]. 浙江农业学报, 2016, 28(3):535-542.
|
| [16] |
张志高, 范留飞, 马晓慧, 等. 2007—2015年新疆粮食增产格局及贡献因素研究[J]. 干旱区资源与环境, 2018, 32(9):71-75.
|
| [17] |
赵聪佳, 董晓光, 王海帆, 等. 河南省粮食生产时空格局变化及其驱动因素[J]. 河南农业大学学报, 2022, 56(2):312-322.
|
| [18] |
张强强, 闫贝贝, 施凡基, 等. 1978—2016年中国水果增产格局及贡献因素研究[J]. 干旱区资源与环境, 2019, 33(10):65-71.
|
| [19] |
严茂林, 周晓亮, 刘自搏, 等. 我国油料增产格局及贡献因素研究[J]. 中国油脂, 2024, 49(4):1-8.
|
| [20] |
吴海中, 田晓四, 胡刚, 等. 2001—2018年安徽省县域茶叶增产时空格局演变[J]. 西华师范大学学报(自然科学版), 2022, 43(1):72-77.
|
| [21] |
吴海中, 田晓四, 陈保平. 安徽省茶叶效益提升空间分异及贡献因素研究[J]. 茶叶科学, 2020, 40(6):845-852.
|
| [22] |
马力阳, 罗其友, 高明杰, 等. 2005—2015年我国马铃薯增产空间分异与贡献因素[J]. 中国农业资源与区划, 2019, 40(9):125-130.
|
| [23] |
吕火明, 赵颖文, 刘宗敏, 等. 四川省粮食生产时空演变特征及其影响因素——基于90个粮食生产重点县视角[J]. 西南农业学报, 2022, 35(9):2220-2228.
|
| [24] |
王刻铭, 黄勇, 刘仲华. 中国茶叶国际竞争力分析[J]. 农业现代化研究, 2020, 41(1):45-54.
|
| [25] |
吴芹瑶, 杨江帆, 林程, 等. 中国茶叶生产布局变迁研究[J]. 茶叶科学, 2022, 42(2):290-300.
|
| [26] |
刘钊. 优质茶叶基地建设评价的实践与探讨[J]. 中国茶叶, 2023, 45(7):60-65.
|
| [27] |
张铭铭, 唐小林, 范起业, 等. 我国茶叶机械研究进展与展望[J]. 中国茶叶加工, 2021(4):5-9.
|
| [28] |
焦佳. 茶叶深加工产(104t)业发展制约因素与发展建议[J]. 现代园艺, 2021, 44(24):21-23.
|
| [29] |
林曦, 吴芹瑶, 杨江帆. 茶旅融合发展效果评价与动力机制研究[J]. 茶叶科学, 2023, 43(5):718-732.
|
| [30] |
王娜. 乡村振兴背景下茶叶产业发展研究[J]. 福建茶叶, 2022, 44(7):12-14.
|
| [1] | 张晓娇, 毛昭庆, 万思琦, 董晓波. 云南省农业碳排放特征及驱动因素分析——基于Kaya恒等式扩展与LMDI指数分解方法[J]. 农学学报, 2025, 15(3): 101-108. |
| [2] | 毛昭庆, 曾贞, 史君怡, 张晓娇, 鄢文光, 伏成秀. 中国茶叶产业竞争力区域比较研究[J]. 农学学报, 2024, 14(9): 75-85. |
| [3] | 陈俊斌, 胡广. 生物多样性在低碳农业中的应用现状及展望[J]. 农学学报, 2024, 14(4): 42-51. |
| [4] | 肖文敏, 任志红, 吴焕焕, 张虹, 孙海伟, 杨圣祥, 李龙, 尚涛. 植物生长调节剂对春茶新梢生长及品质的影响[J]. 农学学报, 2024, 14(11): 7-12. |
| [5] | 毛昭庆, 张远强, 曾贞, 张晓娇, 鄢文光, 伏成秀. 中国茶叶产业集聚水平测度分析[J]. 农学学报, 2024, 14(10): 92-100. |
| [6] | 李玲玉, 陈詹, 周毓莹, 丁菲, 王国槐, 张振乾. 不同种衣剂配方对油菜生长的影响[J]. 农学学报, 2024, 14(10): 1-5. |
| [7] | 张越, 郭耀辉, 赵颖文. 基于LMDI分解模型的中国粮食主产区增产格局及贡献因素研究[J]. 农学学报, 2023, 13(3): 95-101. |
| [8] | 王改革, 任宁, 汪洋, 叶优良, 黄玉芳. 2014—2018年河南省冬小麦施肥现状及增产潜力评价[J]. 农学学报, 2022, 12(2): 8-15. |
| [9] | 王珍珍, 梁希森, 孙莎莎, 张志凯, 崔长磊, 陈晓辉, 梁召坤, 胡柏耿. 马铃薯‘希森6号’一年多点示范试验结果分析[J]. 农学学报, 2021, 11(6): 13-18. |
| [10] | 肖健, 刘慧, 郑福维, 帅细强, 刘松. 不同海拔保靖黄金茶品质形成的气象因子初探[J]. 农学学报, 2021, 11(3): 68-73. |
| [11] | 李琳. 陕西省山阳县茶叶高质量发展存在问题与对策[J]. 农学学报, 2021, 11(2): 86-91. |
| [12] | 季丹丹, 胡燕华, 包君俏, 周晓燕, 周弘媛. 柯桥区茶叶气候风险区划[J]. 农学学报, 2020, 10(4): 83-88. |
| [13] | 胡悦琴, 马燕飞, 张伟科. 中国陆地区土地利用/覆被时空格局变化及驱动力分析[J]. 农学学报, 2020, 10(4): 26-35. |
| [14] | 尹倩,宋玉娥,窦龙祺,杨建辉,刘伟玲,王承国. 茶叶销售信息管理系统的设计与实现[J]. 农学学报, 2019, 9(3): 69-74. |
| [15] | 严建辉. 牡蛎壳土壤调理剂对黄泥田花生产量和土壤酸化改良的影响[J]. 农学学报, 2019, 9(11): 17-20. |
| 阅读次数 | ||||||
|
全文 |
|
|||||
|
摘要 |
|
|||||