欢迎访问《农学学报》,

农学学报 ›› 2021, Vol. 11 ›› Issue (5): 57-61.doi: 10.11923/j.issn.2095-4050.cjas2020-0216

所属专题: 烟草种植与生产

• 林学/园艺/园林/食用菌 • 上一篇    下一篇

1999—2018年四川省烟叶播种面积的年际动态分析

卞建锋1(), 闫芳芳2, 陈冠陶3, 刘杨1, 冯文龙2, 罗万麟1, 王谢3()   

  1. 1中国烟草总公司四川省公司,成都 610000
    2四川烟草公司攀枝花市公司,四川攀枝花 617000
    3四川省农业科学院土壤肥料研究所/农业农村部西南山地环境重点实验室,成都 610066
  • 收稿日期:2020-10-12 修回日期:2021-01-13 出版日期:2021-05-20 发布日期:2021-06-29
  • 通讯作者: 王谢 E-mail:275411178@qq.com;wangxiechangde@hotmail.com
  • 作者简介:卞建锋,男,1984年出生,四川成都人,农艺师,硕士,主要研究方向为烟叶栽培技术。通信地址:610000 成都市高新区世纪城路936号3009室 四川省烟草专卖局(公司),Tel:028-86162852,E-mail: 275411178@qq.com
  • 基金资助:
    中国烟草总公司四川省公司重点科技项目“四川植烟土壤标本制作与查询系统开发”(SCYC202007)

Interannual Dynamics of Tobacco Planting Area in Sichuan Province from 1999 to 2018

Bian Jianfeng1(), Yan Fangfang2, Chen Guantao3, Liu Yang1, Feng Wenlong2, Luo Wanlin1, Wang Xie3()   

  1. 1China Tobacco Corporation, Sichuan Branch, Chengdu 610000, Sichuan, China
    2Sichuan Tobacco Corporation, Panzhihua Branch, Panzhihua 617000, Sichuan, China
    3Institute of Soil and Fertilizer, Sichuan Academy of Agricultural Sciences/ Key Laboratory of Southwest Mountain Environment, Ministry of Agriculture and Rural Affairs, Chengdu 610066, Sichuan, China
  • Received:2020-10-12 Revised:2021-01-13 Online:2021-05-20 Published:2021-06-29
  • Contact: Wang Xie E-mail:275411178@qq.com;wangxiechangde@hotmail.com

摘要:

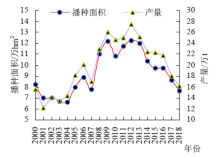
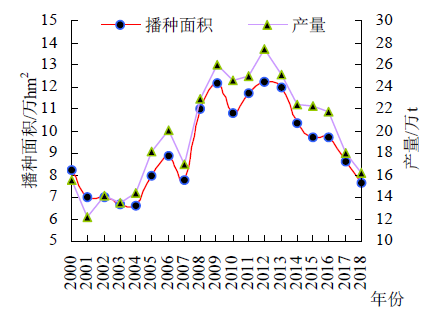
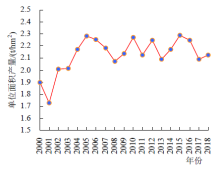
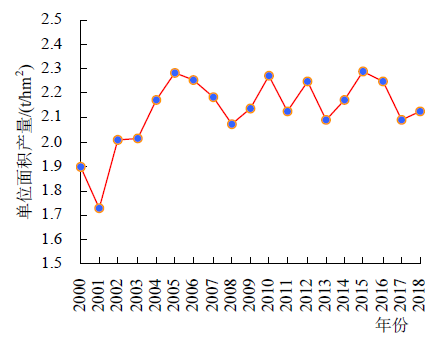
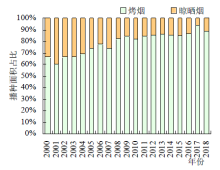
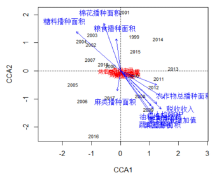
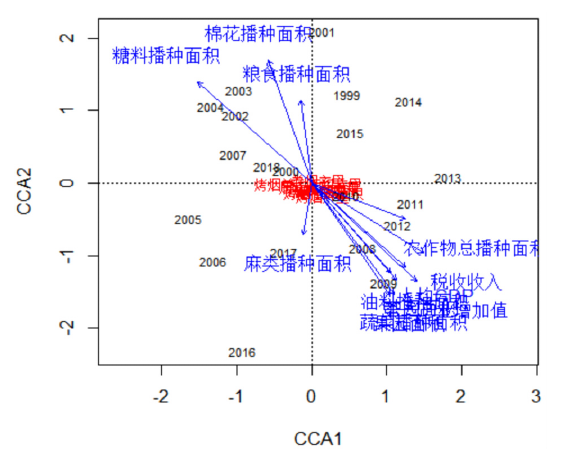
为明确四川省烟叶播种面积的年际动态规律和驱动因子,统计分析了1999—2018年四川省烟叶和烤烟的播种面积和产量;并从四川省人均GDP、第一产业增加值、税收收入等3个宏观经济指标,粮食、油料、棉花、麻类和糖料作物播种面积等5个农田土地利用指标中,筛选出了显著影响烟叶播种面积的指标体系。结果发现:(1)1999—2018年四川烟叶种植面积和产量大体呈现出先增加后降低的趋势。(2)1999—2018年烤烟播种面积占比呈上升趋势,晾晒烟播种面积占比逐年下降。(3)1999—2005年四川烟叶单位面积产量不断提升,之后一直维持在2 t/hm2的水平。(4)烟叶播种面积与第一产业增加值、税收收入呈正相关,而与棉花播种面积、糖料作物播种面积呈负相关。(5)采用逐步回归分析得到AIC最低的回归方程为S烤烟播种面积=-564.100+0.005×GDP人均+0.169×S农作物总播种面积-0.129×S粮食播种面积+0.164×S油料播种面积+5.166×S麻类播种面积-4.469×S糖料播种面积-0.178×S蔬菜播种面积-0.616×S茶园面积-0.323×S果园面积。上述研究结果表明,未来四川省烟叶播种面积将综合受到经济发展、作物播种结构等多方因素影响。

关键词: 四川, 烟叶, 年际动态, 烤烟, 逐步回归分析

Abstract:

To clarify the interannual dynamics and driving factors of tobacco planting area in Sichuan Province, the planting area and yield of tobacco and flue-cured tobacco in Sichuan from 1999 to 2018 were statistically analyzed. Three macroeconomic indicators, including per capita GDP, added value of the primary industry and tax revenue, and five farmland land use indicators, including grain, oil, cotton, bast fiber and sugar crop planting area, were selected to construct the index system that significantly affect tobacco planting area. The results showed that: (1) from 1999 to 2018, the planting area and yield of tobacco in Sichuan increased at first and then decreased; (2) from 1999 to 2018, the proportion of planting area of flue-cured tobacco increased, while that of air-cured tobacco decreased year by year; (3) from 1999 to 2005, the yield of tobacco leaf per unit area in Sichuan increased continuously, and then maintained above the level of 2 t/hm2; (4) the planting area of tobacco was positively correlated with the added value of primary industry and tax revenue, and had a negative correlation with cotton planting area and sugar crop planting area; (5) the regression equation with the lowest AIC in the range of significant difference was obtained by using stepwise regression analysis: Stobacco sown area= -564.100+ 0.005×GDP per capita + 0.169×Stotal sown area of crops- 0.129×Sgrain sown area + 0.164×Soil sown area+ 5.166×Sbast fiber crops sown area- 4.469×Ssugar sown area- 0.178×Svegetable sown area- 0.616×Stea garden area- 0.323×Sorchard area. The results suggest that the tobacco planting area in Sichuan will be affected by economic development, crop planting structure and other factors.

Key words: Sichuan, Tobacco, Interannual Dynamics, Flue-cured Tobacco, Stepwise Regression Analysis

中图分类号: